 Nathan
 Comparative analysis of zebrafish behaviour with end-to-end learning
 The architecture of the AI model used for classification.
The Quick Take
Exploratory data analysis is a time-consuming task that often feels like it has no end. In my thesis, I explored the possibility of using automated means to assist with the process of exploratory data analysis. I drew inspiration from the shift from Machine Learning to Deep Learning about a decade ago. Back then, researchers manually created features, now Deep Learning algorithms derive features directly from data statistics. I designed and trained a Neural Network on zebrafish behavior. In addition, I created two visualisation tools to show what kind of features the network finds, and how important they are. If the model successfully classified the data, a domain expert could identify the features the model had learnt.
Introduction
In traditional hypothesis testing, one sets up the research question and hypothesis before collecting the data - or at least before looking at it. This works well when the effect is clear (e.g., 'Do beer drinkers weigh more than wine drinkers?'), but not when the effect is unclear (e.g., 'How does alcohol affect the brain?'). In this case, you can perform exploratory data analysis, which is defined as: "an approach of analyzing data sets to summarize their main characteristics, often using statistical graphics and other data visualization methods."[1]
This can be a time-consuming and virtually non-exhaustive process, especially for large datasets with many dimensions. In addition, the fact that it is inexhaustive can make analyses incomplete and potentially biased. The goal of my thesis was to figure out a method to aid in the process of exploratory data analysis.
Fortunately, during my studies, one of my professors explained to us why using Deep Learning turned out to be so much more effective at Computer Vision than Machine Learning (see AlexNet). The key difference was the fact that for Machine Learning, one had to create the features that went into the ML algorithm themselves. In the case of Deep Learning, these features were part of the training process, in other words, they were based on the statistics of the data. As the whole process, from input to answer, was now part of the algorithm, this can also be called end-to-end learning.
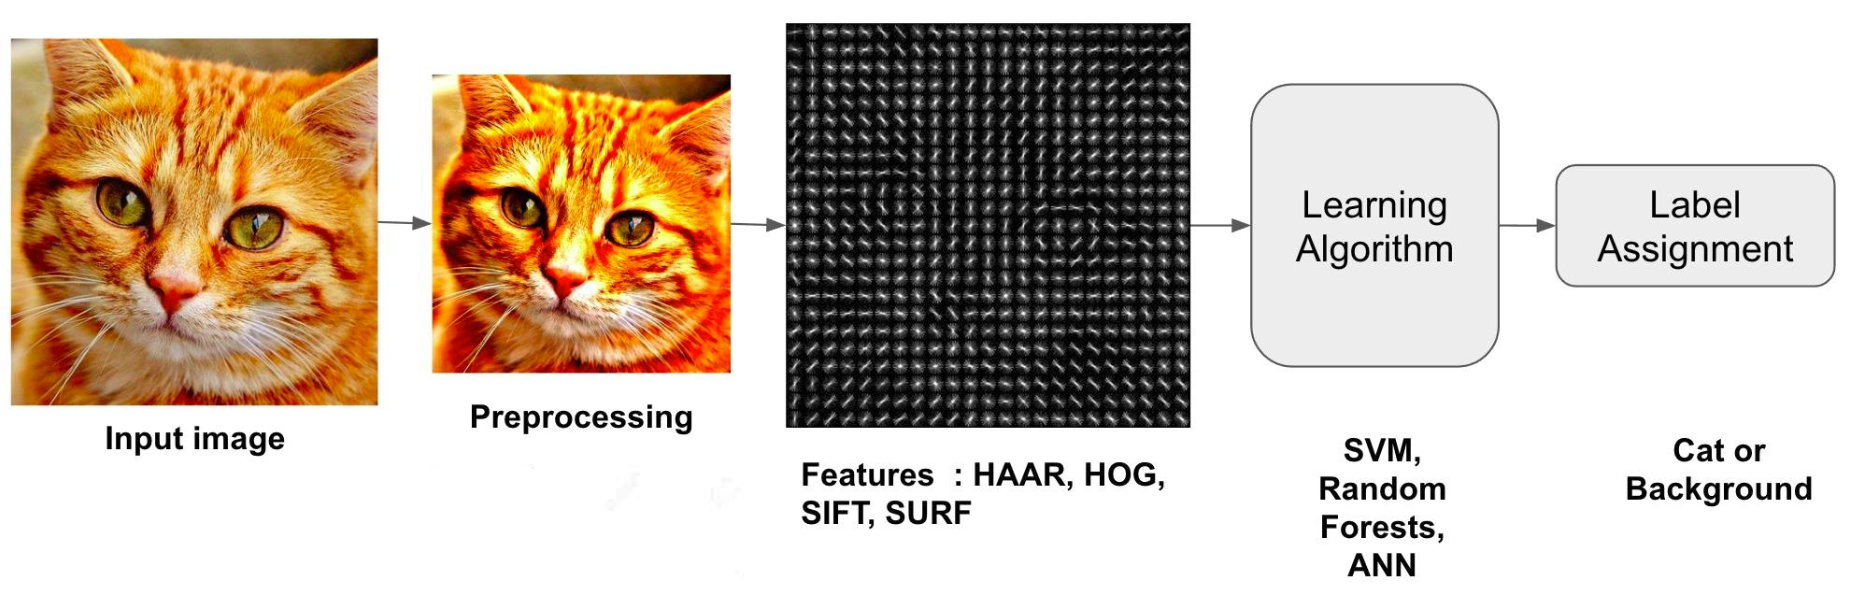 Handcrafted features were used to feed ML algorithms.
How does all of this relate to exploratory data analysis? To see this, you must understand that end-to-end learning and exploratory data analysis are actually trying to achieve the same thing: finding the difference(s) between two (or more) groups. If you give a researcher a dataset of brain activity of people who under the influence of alcohol and people who are not, and ask them about the difference, they'll in essence do a very similar thing as when you give this dataset to a neural network and ask it whether a given sample is someone that is under influence or not.
Execution
With the concept in place, the next step was to test whether this idea could be applied in practice. In other words, I needed to determine whether an end-to-end algorithm could not only classify the data, but also help us learn from it.
I performed a behaviour experiment in a format that was typical for the lab, and made sure that the difference in behaviour between the conditions was clear. Without a clear difference in behaviour, it would be difficult to tell whether the end-to-end learning algorithm had failed, or if there was no real difference in the data.
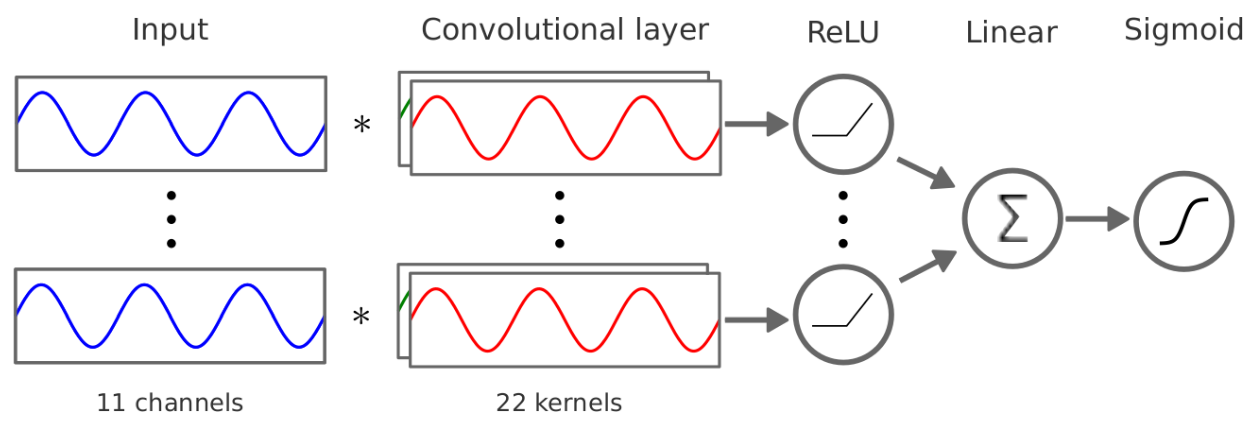
Next, I had to design a Neural Network that could not only classify the dataset, but also reveal the features that it relied on. I worked through a number of designs and ultimately settled on the architecture shown on the top of the page. This architecture creates a good balance between simplicity - needed to visualise the results - and the necessary complexity to successfully classify the data.
It can be broken down into two parts: (1) the convolutional layer, where kernels are trained to detect patterns indicative of one of the two classes. (2) The linear layer, which weighs the kernels and sums their contributions to the classification. If the convolutional layer's job is to pick up on the features, the linear layer's job is to weigh the features in terms of how useful they are for the classification.
Results
After successfully training the model on the dataset of interest (multiple datasets were tested), it can be visualised to assist in exploratory data analysis. The importance of each feature is displayed by plotting its average activation in the linear layer, which indicates how strongly the feature contributes to the final classification. The features are plotted and grouped according to the type of data on which they were trained. These visualisations give insight into the features - or key characteristics - of the data. Very fitting to how we defined exploratory data analysis at the start.